Peru ships most of its fresh mango between October and March, and roughly 80% of the exportable crop grows in one place: the San Lorenzo Valley and surrounding districts of Piura, on the far northern coast. What that crop will look like next season is being decided right now, in the middle of the southern winter, by a single variable that most market reports never mention: how cold the nights get.
This post is our mid-July reading of that variable and everything around it, with the full data. We publish it because we buy roughly 1,000 tonnes of mango every campaign for our dried fruit lines, we compete for that fruit with the fresh exporters, and we have learned that watching the winter closely is worth more than any amount of October speculation. The summary is not comfortable: as of July 14, the 2026 chill window has not produced a single cold night, the ocean off Piura is warmer than it was at this point in 2023, the year that preceded the last harvest collapse, and Peru's official El Niño commission has just raised its forecast again.
Why cold nights decide the campaign
The Kent mango trees of Piura flower only after a period of floral induction, and induction in this variety requires cool nights during June, July and August. The working threshold used by growers and agronomists is an overnight minimum at or below 18 °C; nights in the 15 to 17 °C range are ideal. When the winter delivers 60 to 90 such nights, the valley flowers massively and the campaign is large. When a coastal El Niño keeps the nights warm, the trees simply do not flower, and there is very little that irrigation, nutrition or crop management can do about it.
The mechanism showed its teeth in 2023. That winter produced zero chill nights between June and August, and the 2023/24 campaign collapsed to 83 million kg, roughly a third of a normal year. Peru's export prices doubled, and US wholesale prices for mango of any origin converged upward as the whole market repriced around the missing Peruvian volume.
The 2026 winter so far: zero
We track the overnight minimum daily at the San Lorenzo Valley grid cell using ECMWF ERA5 reanalysis data, which assimilates the local station network. Here is the current picture:
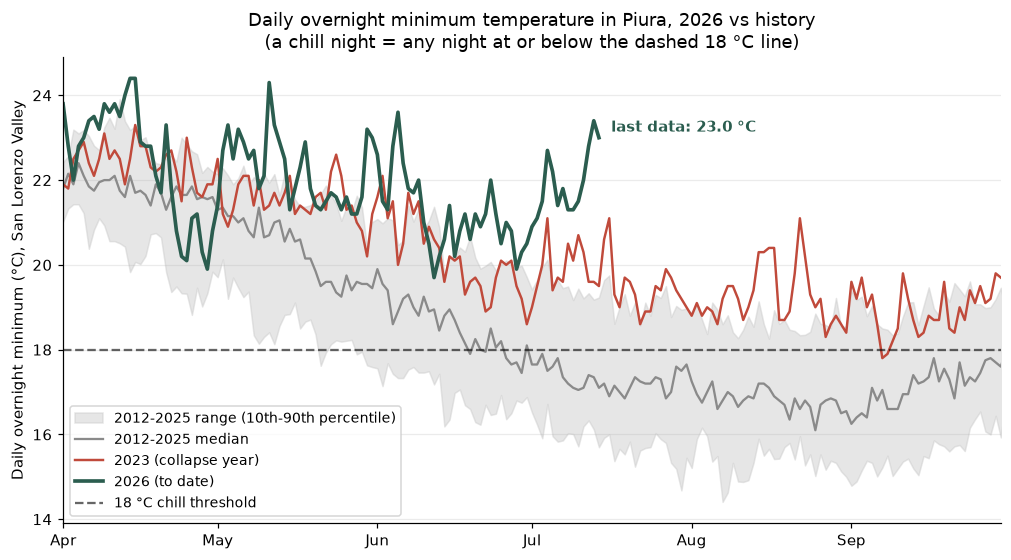
The grey band is where 2012-2025 winters normally travel. The green line, 2026, has not merely stayed above the 18 °C threshold; since late June it has been running above the 90th percentile of history, and in mid-July it was still moving away from the threshold, not toward it. The red line shows 2023, the collapse precursor, which at this point in July was nearly two degrees cooler than 2026 is now.
The cumulative count makes the deficit unambiguous:
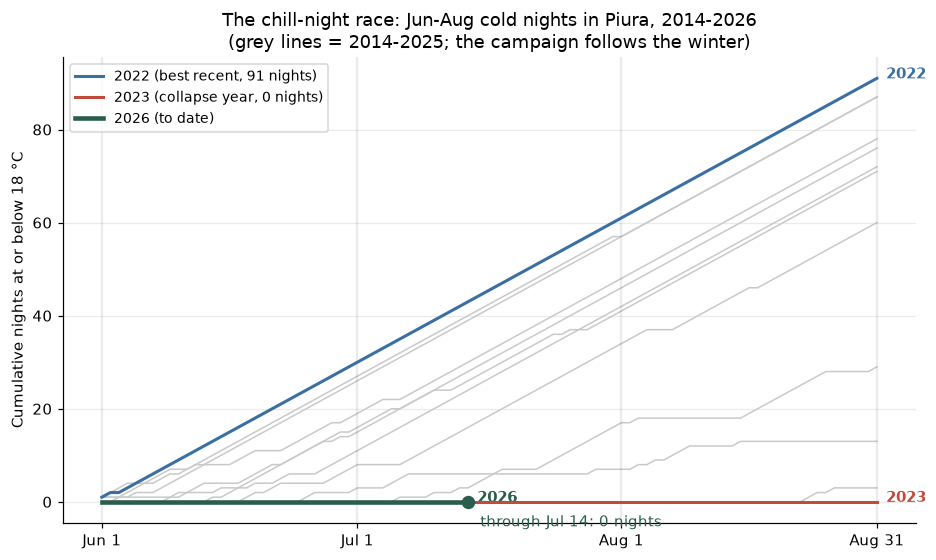
Through July 14, the 2026 window stands at zero nights at or below 18 °C. In the same June 1 to July 14 stretch, the historical median since 2014 is 25 chill nights, and 2022, the best recent winter, had already accumulated 43. Only two other years in our series started this way: 2015 and 2023, and those winters preceded the two smallest campaigns of the modern era, at 129 and 83 million kg against a typical 220 to 260.
The detailed temperature tables
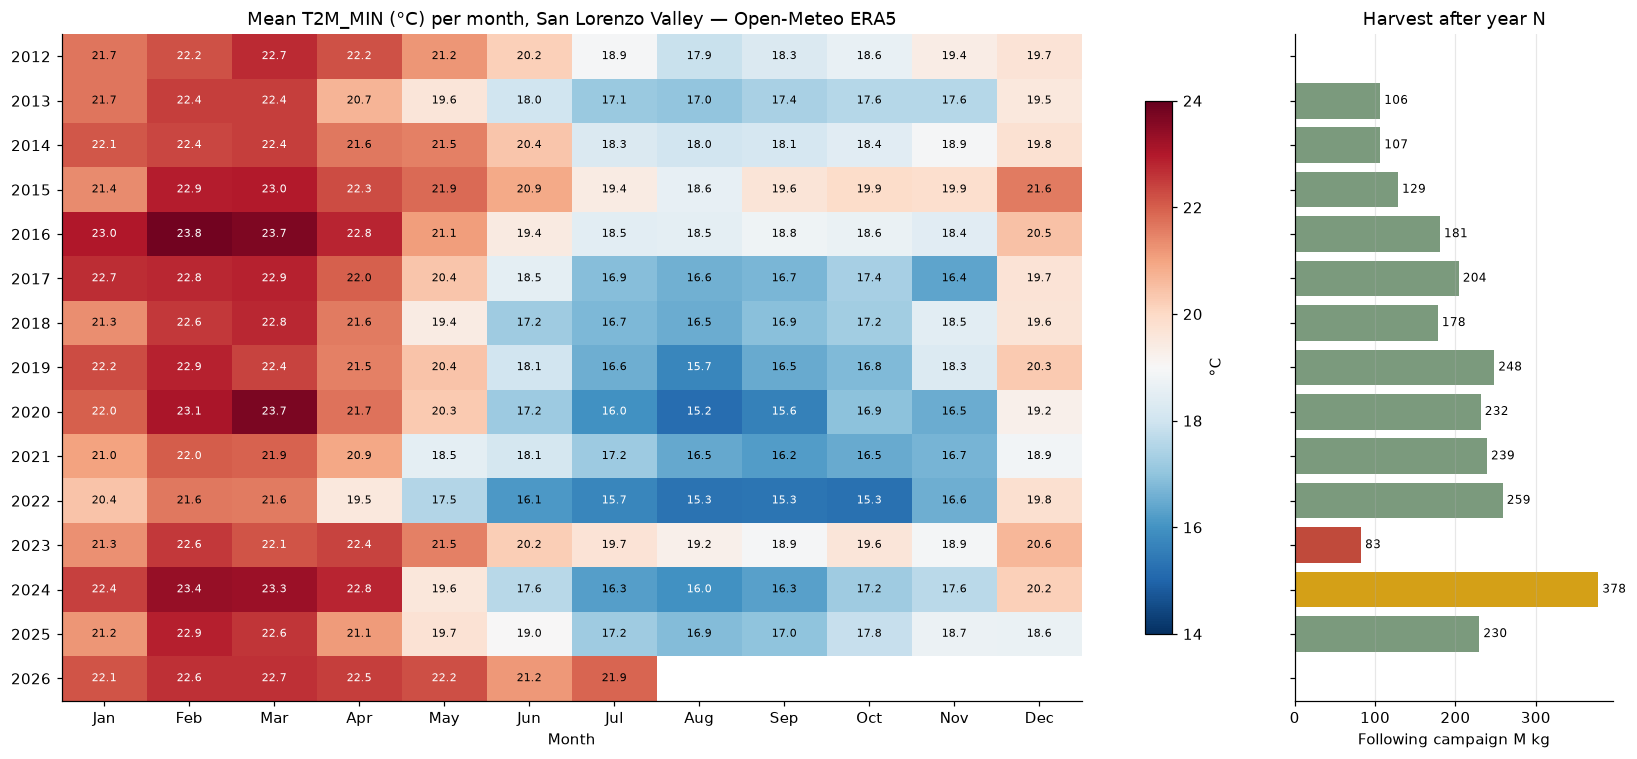
Mean overnight minimum by month (°C), San Lorenzo Valley. The July 2026 figure covers July 1-14:
| Year | May | Jun | Jul | Aug | Sep |
|---|---|---|---|---|---|
| 2014 | 21.5 | 20.4 | 18.3 | 18.0 | 18.1 |
| 2015 | 21.9 | 20.9 | 19.4 | 18.6 | 19.6 |
| 2016 | 21.1 | 19.4 | 18.5 | 18.5 | 18.8 |
| 2017 | 20.4 | 18.5 | 16.9 | 16.6 | 16.7 |
| 2018 | 19.4 | 17.2 | 16.7 | 16.5 | 16.9 |
| 2019 | 20.4 | 18.0 | 16.6 | 15.7 | 16.5 |
| 2020 | 20.3 | 17.2 | 16.0 | 15.2 | 15.6 |
| 2021 | 18.5 | 18.1 | 17.2 | 16.5 | 16.2 |
| 2022 | 17.5 | 16.1 | 15.7 | 15.3 | 15.3 |
| 2023 | 21.5 | 20.2 | 19.7 | 19.2 | 18.9 |
| 2024 | 19.6 | 17.6 | 16.3 | 16.0 | 16.3 |
| 2025 | 19.7 | 19.0 | 17.2 | 16.8 | 17.0 |
| 2026 | 22.2 | 21.2 | 21.9* |
Every 2026 month so far is the warmest of its column in the entire series. July to date is running 2.2 °C above July 2023, the previous warmest July.
Chill nights (Tmin ≤ 18 °C) per month:
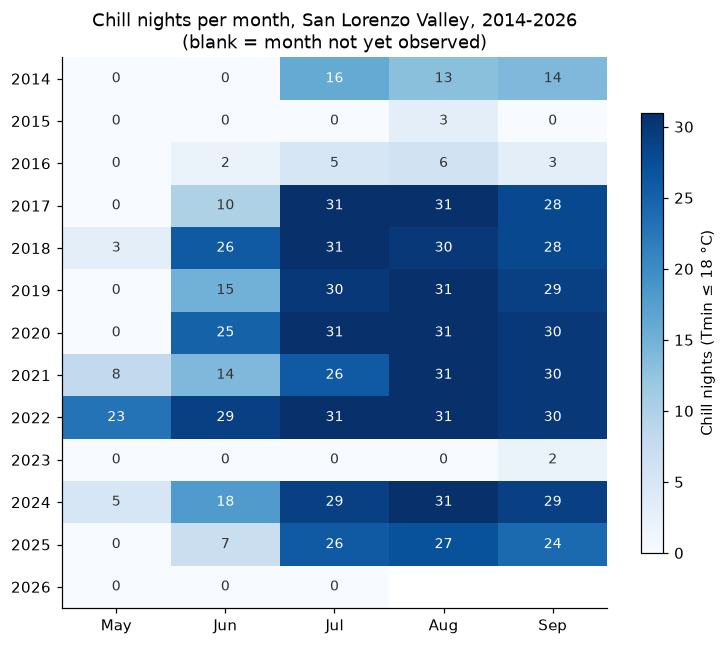
| Year | May | Jun | Jul | Aug | Sep |
|---|---|---|---|---|---|
| 2014 | 0 | 0 | 16 | 13 | 14 |
| 2015 | 0 | 0 | 0 | 3 | 0 |
| 2016 | 0 | 2 | 5 | 6 | 3 |
| 2017 | 0 | 10 | 31 | 31 | 28 |
| 2018 | 3 | 26 | 31 | 30 | 28 |
| 2019 | 0 | 15 | 30 | 31 | 29 |
| 2020 | 0 | 25 | 31 | 31 | 30 |
| 2021 | 8 | 14 | 26 | 31 | 30 |
| 2022 | 23 | 29 | 31 | 31 | 30 |
| 2023 | 0 | 0 | 0 | 0 | 2 |
| 2024 | 5 | 18 | 29 | 31 | 29 |
| 2025 | 0 | 7 | 26 | 27 | 24 |
| 2026 | 0 | 0 | 0* |
And the season-level summary, with the campaign that followed each winter. The coldest-night column is telling: in a normal winter the coldest night lands between 13 and 16 °C, well below threshold. The coldest night of the entire 2026 winter so far is 19.7 °C, which means not one night has even come close:
| Winter | Nights ≤18 °C (Jun-Aug) | Nights ≤16 °C | Mean Tmin | Coldest night | Following campaign (M kg) |
|---|---|---|---|---|---|
| 2014 | 29 | 0 | 18.9 | 16.8 | 106.5 |
| 2015 | 3 | 0 | 19.6 | 17.8 | 128.6 |
| 2016 | 13 | 0 | 18.8 | 17.4 | 180.8 |
| 2017 | 72 | 8 | 17.3 | 15.4 | 204.2 |
| 2018 | 87 | 13 | 16.8 | 15.4 | 178.1 |
| 2019 | 76 | 25 | 16.8 | 13.6 | 248.3 |
| 2020 | 87 | 44 | 16.1 | 14.2 | 231.5 |
| 2021 | 71 | 9 | 17.2 | 15.4 | 239.3 |
| 2022 | 91 | 67 | 15.7 | 14.1 | 258.9 |
| 2023 | 0 | 0 | 19.7 | 18.3 | 82.7 |
| 2024 | 78 | 34 | 16.6 | 14.4 | 377.7 |
| 2025 | 60 | 9 | 17.7 | 15.1 | 229.8 |
| 2026 (to Jul 14) | 0 | 0 | 21.4 | 19.7 | ? |
The long-run pattern, one panel per year, mean overnight minimum for every month since 2012 with the following harvest alongside:
Why the nights are warm: the ocean
Piura's winter nights are cooled by the cold Humboldt water offshore. When that strip of ocean runs warm, the coastal El Niño pattern, the nights follow. The Niño 1+2 index measures exactly that strip, and its 2026 trajectory is the reason the chill window is empty:
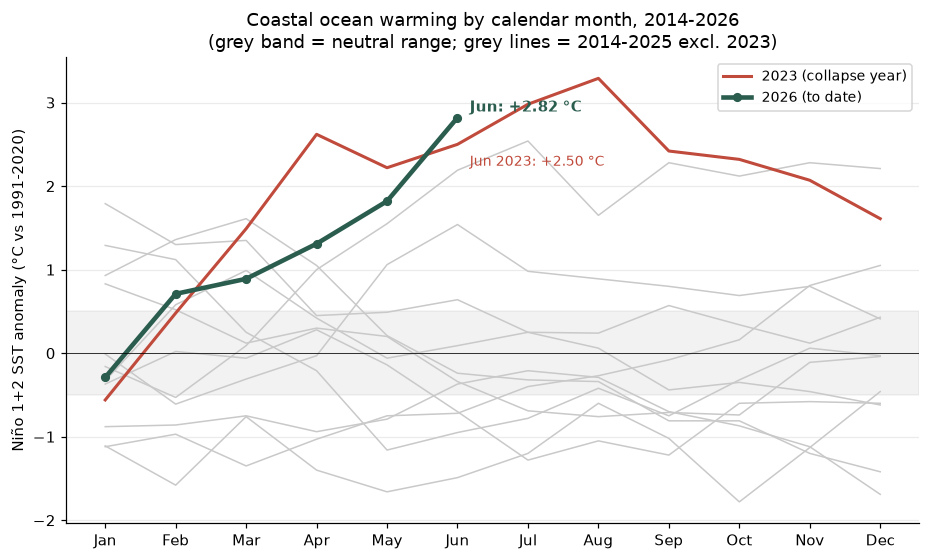
| Month (2026) | Niño 1+2 anomaly | ICEN (official 3-month index) | ENFEN classification |
|---|---|---|---|
| January | -0.29 °C | -0.06 °C | Neutral |
| February | +0.71 °C | +0.42 °C | Weak warm |
| March | +0.89 °C | +0.96 °C | Weak warm |
| April | +1.31 °C | +1.34 °C | Moderate warm |
| May | +1.82 °C | +1.98 °C | Strong warm |
| June | +2.82 °C | pending | pending |
June's +2.82 °C is the fifth consecutive monthly rise, and it crosses above June 2023, which read +2.50 °C. That comparison matters: in 2023 the coastal anomaly had already peaked in autumn and was fading by July, while in 2026 it is still climbing into the heart of the induction window.
ENFEN, the multi-agency Peruvian commission that officially classifies these events, raised its outlook again in Comunicado Oficial N° 13-2026 (July 17). It now expects the coastal El Niño to continue through April 2027, most likely at strong magnitude, with extraordinary magnitude not ruled out toward the end of 2026, and it assigns essentially all July-September probability to warm conditions. For the summer itself, its published magnitude probabilities are:
| Magnitude, Dec 2026 - Mar 2027 (Niño 1+2) | Probability |
|---|---|
| La Niña / Neutral | 0% |
| Weak El Niño | 6% |
| Moderate El Niño | 23% |
| Strong El Niño | 38% |
| Extraordinary El Niño | 33% |
ENFEN also expects above-normal summer rain on the north coast, which is a second, separate risk: heavy January-March rain damages fruit quality and complicates harvest logistics for whatever volume does set.
What history says this means for volume
Across the twelve completed campaigns since 2014/15, the relationship between winter chill and the following campaign is strong for a biological system measured at national scale: each additional chill night has been worth roughly 1.7 million kg of export volume, with the chill count alone explaining about half the variance (R² = 0.53).
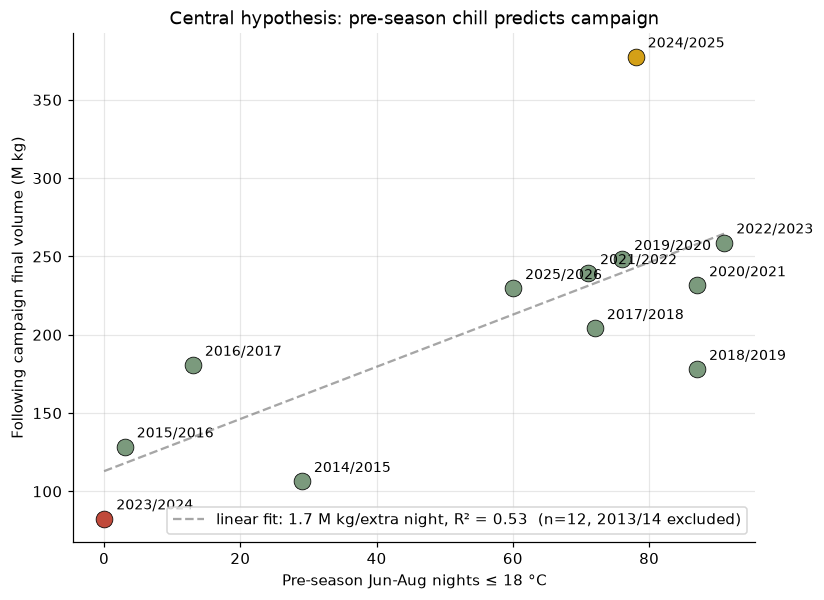
Translating the current winter through that relationship, adjusted for planted area, gives the range of outcomes below. Weighting by ENFEN's probabilities, the base case is the severe scenario: a central estimate around 101 million kg, with a 10-90% band of 28 to 174. For perspective, that central estimate is less than half of the 238 million kg average of the last five campaigns and sits just above the 2023/24 collapse.
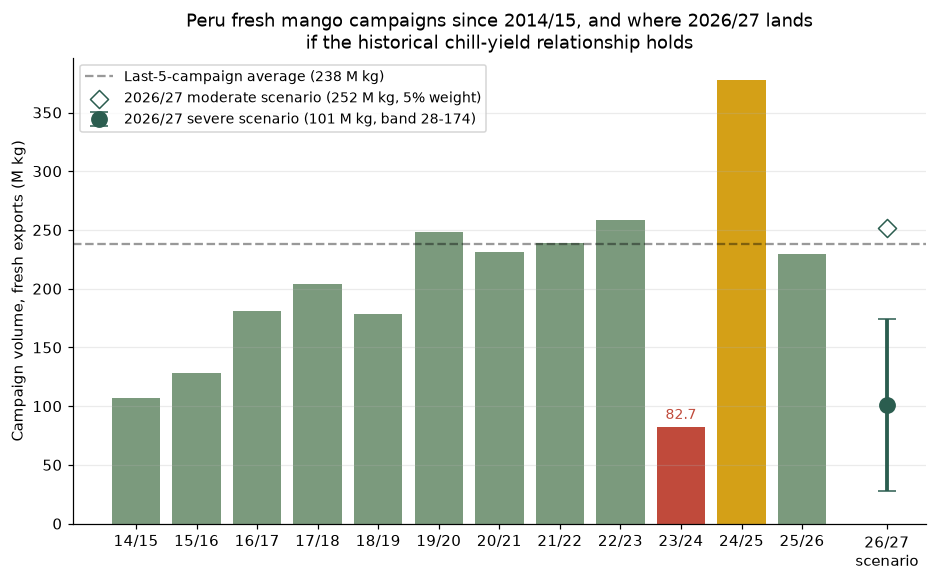
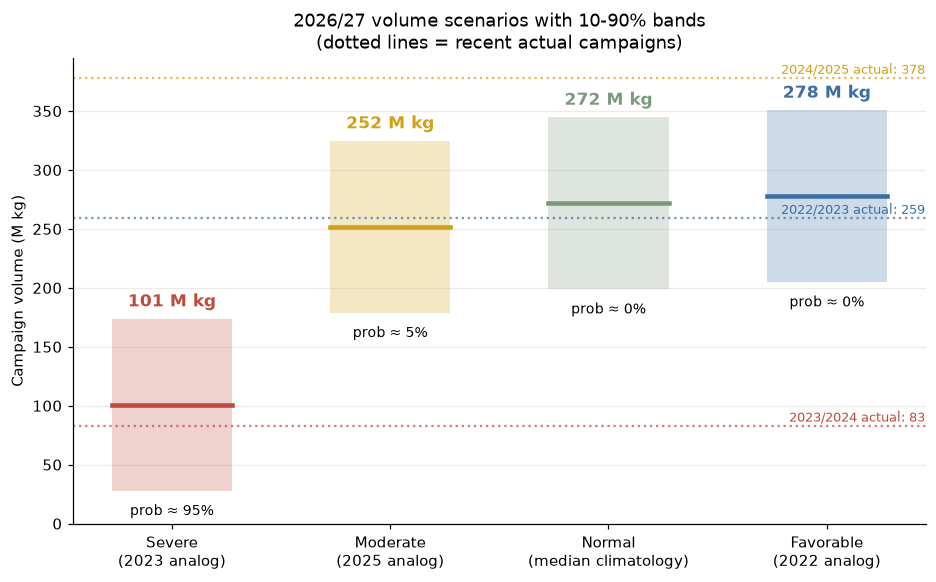
| Scenario | Probability (ENFEN-weighted) | Volume, M kg (10 / 50 / 90%) |
|---|---|---|
| Severe (2023 analog) | 95% | 28 / 101 / 174 |
| Moderate (warm, 2025 analog) | 5% | 179 / 252 / 325 |
| Normal (median climatology) | ~0% | 199 / 272 / 345 |
| Favorable (cool, 2022 analog) | ~0% | 205 / 278 / 351 |
Two honest caveats belong next to that table. First, twelve campaigns is a small sample, and our cross-validated statistical models do not yet beat a simple baseline, so these numbers are arithmetic from the observed chill-yield relationship and ENFEN's published probabilities, not a machine-learning forecast. Second, a genuine cold incursion in late July or August would still move the outcome materially; 2016 showed that a mediocre winter can partially rescue itself. Each warm week removes one more path to a normal campaign, but the window is not closed until September.
One practical lesson from the last collapse is worth repeating for buyers. In 2023/24, switching to Mexican origin did not provide a price escape: US wholesale prices for Mexican and Peruvian fruit converged at the same elevated level as the whole market repriced. Alternative origins solve availability, not cost.
What happens next
Fruit in Piura trades on a spot basis, and nobody at origin can responsibly fix prices or volumes with growers before the crop shows itself, which in a year like this means late September or October. What can be done between now and then is planning: understanding your volume needs, watching the same data we watch, and being ready to move quickly when quoting opens.
We will publish the next update after ENFEN's August 14 comunicado, by which point the full July chill data will be in and the picture should be close to settled. The markers we are watching, in order of importance: the Jun-Aug chill-night count against its median of 72, the monthly Niño 1+2 readings, ENFEN's magnitude classification, and the volume of the first October shipment weeks in customs data.
Methodology and sources
Temperature: ECMWF ERA5 reanalysis, daily overnight minimum at the San Lorenzo Valley grid cell (0.1° resolution), 2012 to present, via the Open-Meteo historical archive. Export volumes and prices: Peruvian customs records (Veritrade), fresh conventional mango, campaigns defined October through September. Ocean indices: NOAA ERSSTv5 for Niño 1+2; ICEN and event classifications from ENFEN/IGP. Forecast probabilities: ENFEN Comunicado Oficial N° 13-2026 (July 17, 2026). Planted-area figures are our own estimates pending verification against MIDAGRI data, and the yield scenarios inherit that uncertainty. Charts and tables were generated from our internal data warehouse on July 20, 2026.
Villa Andina is an organic superfoods manufacturer and exporter based in Peru. We produce dried mango, banana, pineapple and goldenberry, cacao derivatives, maca and Andean grains for industrial and retail customers in North America, Europe and Asia.